Using Microsoft Chart In SharePoint 2007
- Published on
- -6 min read
As promised, I have been busy creating a custom web part to display Microsoft Charts within my SharePoint reporting dashboard. Before you even think of wanting to use Microsoft Chart in a SharePoint environment, there are a few boring tasks you need to carry out beforehand:
Step 1: Copy Charting Files To SharePoint
- Download Microsoft Chart here.
- Ensure the System.Web.DataVisualization.dll is in the GAC of your SharePoint server. If not, go to your Microsoft Chart installation directory (C:\Program Files\Microsoft Chart Controls\Assemblies). You will find all the dll’s here.
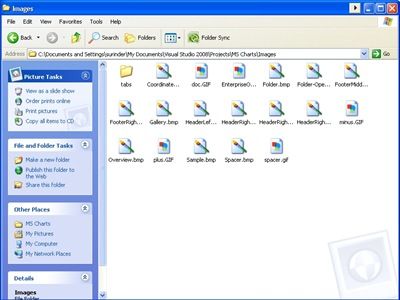
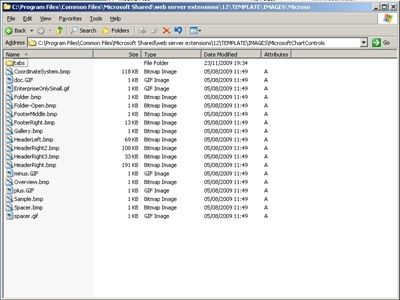
- Copy the charting images from the MS Chart project directory.
 4. On your SharePoint server, go to the 12 hive and create a new folder called “MicrosoftChartControls” in the Images directory.
Step 2: Modify SharePoint’s Web.Config File
- Add “System.Web.DataVisualization” to the SafeControls section.
<SafeControls>
    ...
    ...
    <SafeControl Assembly="System.Web.DataVisualization, Version=3.5.0.0, Culture=neutral, PublicKeyToken=31bf3856ad364e35"  Namespace="System.Web.UI.DataVisualization.Charting" TypeName="*" Safe="True" AllowRemoteDesigner="True"/>
</SafeControls>
- Add the “ChartImg.axd” path to httpHandlers section.
<httpHandlers>
    ...
    ...
    <add verb="*" path="ChartImg.axd" type="System.Web.UI.DataVisualization.Charting.ChartHttpHandler, System.Web.DataVisualization, Version=3.5.0.0, Culture=neutral, PublicKeyToken=31bf3856ad364e35" validate="false"/>
</httpHandlers>
- Add a new AppSetting after the </system.workflow.componentmodel.workflowcompiler> tag. As you can see, this AppSetting contains the URL to where our charting images are stored.
</System.Workflow.ComponentModel.WorkflowCompiler>
<appSettings>
    <add key="ChartImageHandler" value="storage=memory;timeout=20;URL=/_layouts/Images/MicrosoftChartControls/" />
</appSettings>
- Lastly, ensure you add your own custom web part charting control to the SafeControls section as I have done.
<SafeControl Assembly="MOSSCharts, Version=1.0.0.0, Culture=neutral, PublicKeyToken=d463a6b3aa294272" Namespace="MOSSCharts" TypeName="*" Safe="True" AllowRemoteDesigner="True" />
If you still have problems with SharePoint failing to recognise the charting API, view this MSDN Forum posting.
My Custom Chart Example – Bar Chart
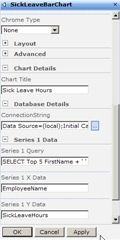
I decided it would be more useful to create a charting web part that would display graphical data from a database, instead of using randomised or hard coded values. My charting web part contains the following properties:
- Chart Title
- Database Connection String – in the real world you wouldn’t include this property. But it just makes it so much more easier to change database connection strings.
- Series 1 Query – will contain a SQL Query based on the results you want returned.
- Series 1 X Data – the column data you want displayed in the Bar Chart X Axis.
- Series 1 Y Data - the column data you want displayed in the Bar Chart Y Axis.
Based on the properties above, your chart will look something like this:
This is how you can create the Bar Chart web part:
using System;
using System.Collections.Generic;
using System.Linq;
using System.Text;
using System.Web.UI;
using System.Web.UI.DataVisualization.Charting;
using System.Drawing;
using System.Data;
using System.Data.Sql;
using Microsoft.SharePoint;
using System.Web.UI.WebControls.WebParts;
using System.Data.SqlClient;
using System.ComponentModel;
using Microsoft.SharePoint.WebPartPages;
using System.Web.UI.WebControls;

namespace MOSSCharts
{
    public class BarChart : Microsoft.SharePoint.WebPartPages.WebPart
    {
        private string chartName;
        [WebBrowsable(true), Personalizable(true)]
        [Category("Chart Details")]
        [FriendlyName("Chart Title")]
        public string ChartName
        {
            get { return chartName; }
            set { chartName = value; }
        }

        private string connectionString;
        [WebBrowsable(true), Personalizable(true)]
        [Category("Database Details")]
        public string ConnectionString
        {
            get { return connectionString; }
            set { connectionString = value; }
        }

        private string querySeries1;
        [WebBrowsable(true), Personalizable(true)]
        [Category("Series 1 Data")]
        [FriendlyName("Series 1 Query")]
        public string QuerySeries1
        {
            get { return querySeries1; }
            set { querySeries1 = value; }
        }

        private string xColumnDataSeries1;
        [WebBrowsable(true), Personalizable(true)]
        [Category("Series 1 Data")]
        [FriendlyName("Series 1 X Data")]
        public string XColumnDataSeries1
        {
            get { return xColumnDataSeries1; }
            set { xColumnDataSeries1 = value; }
        }

        private string yColumnDataSeries1;
        [WebBrowsable(true), Personalizable(true)]
        [Category("Series 1 Data")]
        [FriendlyName("Series 1 Y Data")]
        public string YColumnDataSeries1
        {
            get { return yColumnDataSeries1; }
            set { yColumnDataSeries1 = value; }
        }

        protected override void CreateChildControls()
        {
            SPSecurity.RunWithElevatedPrivileges(delegate()
            {
                try
                {
                    //**************************************************************
                    //Create Connection String
                    //**************************************************************
                    SqlConnection sqlConn = new SqlConnection(ConnectionString);

                    //**************************************************************
                    // Create Chart Control
                    //**************************************************************
                    Chart barChart = new Chart();
                    barChart.Width = 412;
                    barChart.Height = 296;

                    //Specify palatte to use
                    barChart.Palette = ChartColorPalette.BrightPastel;

                    if (!String.IsNullOrEmpty(ChartName))
                    {
                        Title t = new Title(ChartName, Docking.Top, new System.Drawing.Font("Trebuchet MS", 14, System.Drawing.FontStyle.Bold), System.Drawing.Color.FromArgb(26, 59, 105));
                        barChart.Titles.Add(t);
                    }

                    //Create chart area
                    barChart.ChartAreas.Add("ChartArea1");

                    // Show as 3D
                    barChart.ChartAreas["ChartArea1"].Area3DStyle.Enable3D = true;

                    // Show columns as clustered
                    barChart.ChartAreas["ChartArea1"].Area3DStyle.IsClustered = false;

                    // Show X axis end labels
                    barChart.ChartAreas["ChartArea1"].AxisX.LabelStyle.IsEndLabelVisible = true;

                    // Set rotation angles
                    barChart.ChartAreas["ChartArea1"].Area3DStyle.Inclination = 15;
                    barChart.ChartAreas["ChartArea1"].Area3DStyle.Rotation = 20;

                    //**************************************************************
                    // Add series data to chart
                    //**************************************************************

                    //Create Series 1 if there is data
                    if (!String.IsNullOrEmpty(XColumnDataSeries1) && !String.IsNullOrEmpty(YColumnDataSeries1) && !String.IsNullOrEmpty(QuerySeries1))
                    {
                        //Add a new series
                        barChart.Series.Add("Series1");

                        // Set series chart type
                        barChart.Series["Series1"].ChartType = SeriesChartType.Column;

                        // Draw as 3D Cylinder
                        barChart.Series["Series1"]["DrawingStyle"] = "Cylinder";

                        barChart.Series["Series1"].BorderColor = Color.FromArgb(26, 59, 105);
                        barChart.Series["Series1"].Color = Color.CornflowerBlue;
                        barChart.Series["Series1"].BackSecondaryColor = Color.Navy;
                        barChart.Series["Series1"].BackGradientStyle = GradientStyle.DiagonalLeft;

                        barChart.Series["Series1"]["PointWidth"] = "0.8";

                        SqlCommand sqlCmdSeries1 = new SqlCommand(QuerySeries1, sqlConn);

                        barChart.DataSource = sqlCmdSeries1;

                        barChart.Series["Series1"].XValueMember = XColumnDataSeries1;
                        barChart.Series["Series1"].YValueMembers = YColumnDataSeries1;

                    }

                    barChart.DataBind();

                    Controls.Add(barChart);
                }
                catch (Exception ex)
                {
                    Label lblError = new Label();
                    lblError.Text = "An error has occurred. Please ensure you have entered correct chart details";

                    Controls.Add(lblError);
                }
            });
        }
    }
}
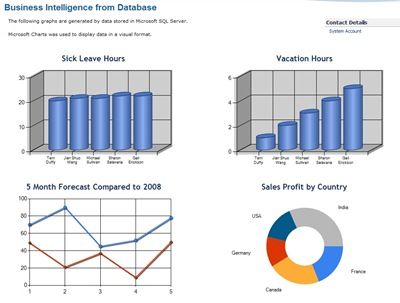
The code (above) provides a basis to display a database driven chart within SharePoint. With some further tweaks, your Reporting Dashboard could look something like this:
If you would like the code for some of my other charts displayed within my Reporting Dashboard, please leave a comment.
Before you go...
If you've found this post helpful, you can buy me a coffee. It's certainly not necessary but much appreciated!
Leave A Comment
If you have any questions or suggestions, feel free to leave a comment. Your comment will not only help others, but also myself.


