Outputting Custom Made Charts To An ASP.NET Page
A few weeks ago I was trying to implement a Bar and Pie Chart for a report in a web application. I found that most of the charting solutions on the web cost an arm and a leg. So I decided to have a bash at creating my own one.
I have been reading through the MCTS Application Development Foundation book and found a couple of chapters on using System.Drawing namespace to output graphics and create Pie Charts in a C# application. Great stuff! However, I encountered a problem when my Chart was rendered within a web page that contains other HTML content. For some reason there was no HTML in my page and all that was displayed was my Chart.
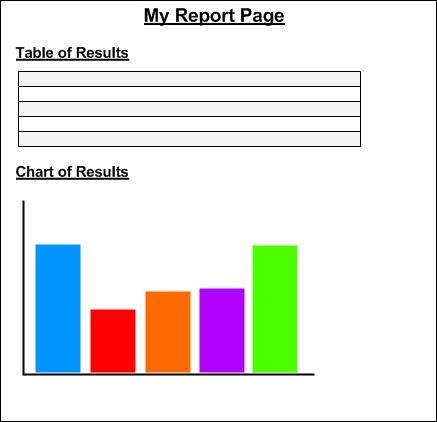
This is how I wanted my chart to be inserted into my page:

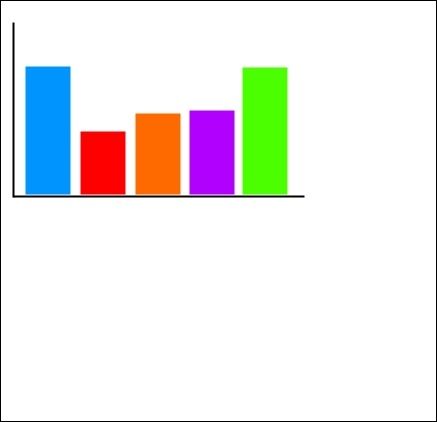
However, when my charting code was added, my page looked like this:

After investigating this problem further it seems that when you output the chart image to a stream the whole page is rendered as an image which removes all the HTML. For example:
Response.ContentTye = "image/gif"; //MIME type
Bitmap.Save(Response.OutputStream, ImageFormat.Gif);
In order to get around this problem required quite a strange work around:
- In the page where you need to the chart to be displayed (we will call Report.aspx) add an ASP Image control that will link to an .aspx page that will contain your chart. Things will become more clearer in the next step.
<asp:Image ID="imgSelfAverageBarChart" ImageUrl="/Charts/BarChart.aspx" runat="server" />
- Create a new ASP.NET page that will contain all the code for your chart (we will call BarChart.aspx). Now you might be thinking how can I send the figures to the chart? Well this can be done be using Session variables or parameters within the web page link that you used in your ImageUrl in the Report.aspx page.
using System.Web.Security;
using System.Web.UI;
using System.Web.UI.WebControls;
using System.Web.UI.WebControls.WebParts;
using System.Web.UI.HtmlControls;
using System.Drawing;
using System.Drawing.Drawing2D;
using System.Drawing.Imaging;
public partial class BarChart : System.Web.UI.Page
{
    protected void Page_Load(object sender, EventArgs e)
    {
        try
        {
            List<string> Questions = new List<string>();
            List<float> Values = new List<float>();

            //Check the session values have values
            if (Session["Sections"] != null && Session["SelfAverageValue"] != null)
            {
                Questions = (List<string>)Session["Sections"];
                Values = (List<float>)Session["SelfAverageValue"];
            }

            Bitmap imageBitmap = new Bitmap(600, 285);
            Graphics g = Graphics.FromImage(imageBitmap);
            g.SmoothingMode = SmoothingMode.AntiAlias;
            g.Clear(Color.White);

            Brush[] brushes = new Brush[5];
            brushes[0] = new SolidBrush(Color.FromArgb(255, 216, 0));
            brushes[1] = new SolidBrush(Color.FromArgb(210, 219, 252));
            brushes[2] = new SolidBrush(Color.FromArgb(0, 127, 70));
            brushes[3] = new SolidBrush(Color.FromArgb(0, 148, 255));
            brushes[4] = new SolidBrush(Color.FromArgb(190, 99, 255));

            int xInterval = 70;
            int width = 60;
            float height = 0;

            //Draw the Pie Chart
            for (int i = 0; i < Values.Count; i++)
            {
                height = (Values[i] * 40);        // adjust barchart to height of Bitmap
                //Draws the bar chart using specific colours
                g.FillRectangle(brushes[i], xInterval * i + 50, 260 - height, width, height);
                //Draw legend
                g.FillRectangle(brushes[i], 420, 25 + (i * 50), 25, 25);
                g.DrawString(Questions[i], new Font("Arial", 8, FontStyle.Bold), Brushes.Black, 450, 31 + (i * 50));
                // Draw the scale
                g.DrawString(Convert.ToString(Math.Round(Convert.ToDecimal(Values[i]), 2)),
                new Font("Arial", 10, FontStyle.Bold), Brushes.Black, xInterval * i + 45 + (width / 3), 300 - height);
                // Draw the axes
                g.DrawLine(Pens.Black, 40, 10, 40, 260);        //   y-axis
                g.DrawLine(Pens.Black, 20, 260, 400, 260);       //  x-axis
            }

            Response.ContentType = "image/gif";
            imageBitmap.Save(Response.OutputStream, ImageFormat.Gif);
            imageBitmap.Dispose();
            g.Dispose();
        }
        catch
        {
        }
    }
}
- Go back to Report.aspx page and add the code to parse your values in a Session.
//Some code that carried out calculations
//Calculated the averages
float selfAverageTotal = selfAssessValue / numberOfSections;
float otherAverageTotal = otherAssessValue / numberOfSections;
//Add generic list
List<string> questions = new List<string>(); //To store the names of x and y axis
List<float> averages = new List<float>();    //To store the values
questions.Add("Self Average Total");
averages.Add(selfAverageTotal);
questions.Add("Other Average Total");
averages.Add(otherAverageTotal);
//Parse lists to session variables
Session["Questions"] = questions;
Session["AverageValue"] = averages;
So the idea of this is that the Chart.aspx will just the render our chart and we don't care if the HTML gets wiped in this web page since we only want the image.
You might be thinking: Why didn't you use a User Control? Well this is one of the first things I tried when trying to resolve this issue which I believe would have been a nicer implementation. Unfortunately, my report page HTML still got rendered as an image.
If anyone knows a better way to output a chart to a webpage, then please leave a comment! Thanks!
Oh yeah, and here is what my Bar Chart looked liked by using the above code:


