Blog

Categorised by 'ASP.NET'.

  • I always used NULL and DBNULL interchangeably in my coding around my database results without ever considering what were the differences. Fortunately, I stumbled upon a great blog written by Bilal Haidar, "Difference between NULL and DBNull"

    If I understand correctly, you use DBNULL to check if a certain field in a database is null and you would use NULL to check if a whole record is not found in the database.

  • A few weeks ago I was trying to implement a Bar and Pie Chart for a report in a web application. I found that most of the charting solutions on the web cost an arm and a leg. So I decided to have a bash at creating my own one.

    I have been reading through the MCTS Application Development Foundation book and found a couple of chapters on using System.Drawing namespace to output graphics and create Pie Charts in a C# application. Great stuff! However, I encountered a problem when my Chart was rendered within a web page that contains other HTML content. For some reason there was no HTML in my page and all that was displayed was my Chart.

    This is how I wanted my chart to be inserted into my page:
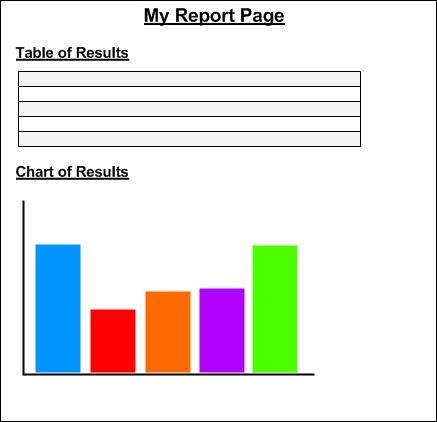
    ChartScreenshot1

    However, when my charting code was added, my page looked like this:
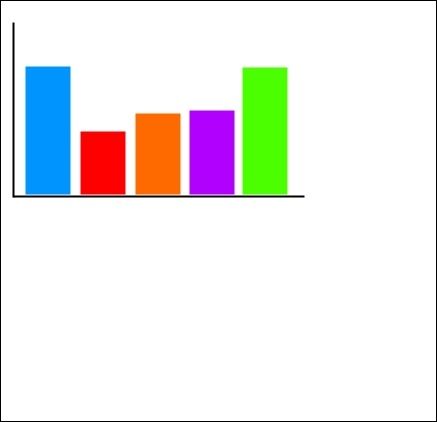
    ChartScreenshot2

    After investigating this problem further it seems that when you output the chart image to a stream the whole page is rendered as an image which removes all the HTML. For example:

    Response.ContentTye = "image/gif"; //MIME type
    Bitmap.Save(Response.OutputStream, ImageFormat.Gif);
    

    In order to get around this problem required quite a strange work around:

    1. In the page where you need to the chart to be displayed (we will call Report.aspx) add an ASP Image control that will link to an .aspx page that will contain your chart. Things will become more clearer in the next step.
    <asp:Image ID="imgSelfAverageBarChart" ImageUrl="/Charts/BarChart.aspx" runat="server" />
    
    1. Create a new ASP.NET page that will contain all the code for your chart (we will call BarChart.aspx). Now you might be thinking how can I send the figures to the chart? Well this can be done be using Session variables or parameters within the web page link that you used in your ImageUrl in the Report.aspx page.
    using System.Web.Security;
    using System.Web.UI;
    using System.Web.UI.WebControls;
    using System.Web.UI.WebControls.WebParts;
    using System.Web.UI.HtmlControls;
    using System.Drawing;
    using System.Drawing.Drawing2D;
    using System.Drawing.Imaging;
    public partial class BarChart : System.Web.UI.Page
    {
        protected void Page_Load(object sender, EventArgs e)
        {
            try
            {
                List<string> Questions = new List<string>();
                List<float> Values = new List<float>();
        
                //Check the session values have values
                if (Session["Sections"] != null && Session["SelfAverageValue"] != null)
                {
                    Questions = (List<string>)Session["Sections"];
                    Values = (List<float>)Session["SelfAverageValue"];
                }
        
                Bitmap imageBitmap = new Bitmap(600, 285);
                Graphics g = Graphics.FromImage(imageBitmap);
                g.SmoothingMode = SmoothingMode.AntiAlias;
                g.Clear(Color.White);
        
                Brush[] brushes = new Brush[5];
                brushes[0] = new SolidBrush(Color.FromArgb(255, 216, 0));
                brushes[1] = new SolidBrush(Color.FromArgb(210, 219, 252));
                brushes[2] = new SolidBrush(Color.FromArgb(0, 127, 70));
                brushes[3] = new SolidBrush(Color.FromArgb(0, 148, 255));
                brushes[4] = new SolidBrush(Color.FromArgb(190, 99, 255));
        
                int xInterval = 70;
                int width = 60;
                float height = 0;
        
                //Draw the Pie Chart
                for (int i = 0; i < Values.Count; i++)
                {
                    height = (Values[i] * 40);        // adjust barchart to height of Bitmap
                    //Draws the bar chart using specific colours
                    g.FillRectangle(brushes[i], xInterval * i + 50, 260 - height, width, height);
                    //Draw legend
                    g.FillRectangle(brushes[i], 420, 25 + (i * 50), 25, 25);
                    g.DrawString(Questions[i], new Font("Arial", 8, FontStyle.Bold), Brushes.Black, 450, 31 + (i * 50));
                    // Draw the scale
                    g.DrawString(Convert.ToString(Math.Round(Convert.ToDecimal(Values[i]), 2)), 
                    new Font("Arial", 10, FontStyle.Bold), Brushes.Black, xInterval * i + 45 + (width / 3), 300 - height);
                    // Draw the axes
                    g.DrawLine(Pens.Black, 40, 10, 40, 260);        //   y-axis
                    g.DrawLine(Pens.Black, 20, 260, 400, 260);       //  x-axis
                }
        
                Response.ContentType = "image/gif";
                imageBitmap.Save(Response.OutputStream, ImageFormat.Gif);
                imageBitmap.Dispose();
                g.Dispose();
            }
            catch
            {
            }
        }
    }
    
    1. Go back to Report.aspx page and add the code to parse your values in a Session.
    //Some code that carried out calculations
    //Calculated the averages
    float selfAverageTotal = selfAssessValue / numberOfSections;
    float otherAverageTotal = otherAssessValue / numberOfSections;
    //Add generic list
    List<string> questions = new List<string>(); //To store the names of x and y axis
    List<float> averages = new List<float>();    //To store the values
    questions.Add("Self Average Total");
    averages.Add(selfAverageTotal);
    questions.Add("Other Average Total");
    averages.Add(otherAverageTotal);
    //Parse lists to session variables
    Session["Questions"] = questions;
    Session["AverageValue"] = averages;
    

    So the idea of this is that the Chart.aspx will just the render our chart and we don't care if the HTML gets wiped in this web page since we only want the image.

    You might be thinking: Why didn't you use a User Control? Well this is one of the first things I tried when trying to resolve this issue which I believe would have been a nicer implementation. Unfortunately, my report page HTML still got rendered as an image.

    If anyone knows a better way to output a chart to a webpage, then please leave a comment! Thanks!

    Oh yeah, and here is what my Bar Chart looked liked by using the above code: Sample Chart Output

  • Published on
    -
    1 min read

    Programmatically Using SqlDataSource

    The SqlDataSource control enables you to use a Web control to access data located in a relational data base, including Microsoft SQL Server and Oracle databases, as well as OLE DB and ODBC data sources. You can use the SqlDataSource control with other controls that display data, such as the GridView, FormView, and DetailsView controls, to display and manipulate data on an ASP.NET Web page, using little or no code.

    protected void PopulateComments(string recordNo)
    {
        //Connection to database
        string connString = ConfigurationManager.ConnectionStrings["ConnectionString"].ConnectionString;
        
        SqlDataSource sqlDataSource = 
            new SqlDataSource(connString, "SELECT [CommComments], [RelComments], [ManageComments], [RoleComments], [PersonalComments] FROM [tblSurveyResults] WHERE ([SurveyID] = @SurveyID)");
    
        sqlDataSource.SelectParameters.Add(new Parameter("SurveyID", System.TypeCode.Int32, recordNo));
        
        System.Data.DataView dv = (System.Data.DataView)sqlDataSource.Select(DataSourceSelectArguments.Empty);
        
        //Output Comments to label controls
        lblQuestion1Comments.Text = dv[0][0].ToString();
        lblQuestion2Comments.Text = dv[0][1].ToString();
        lblQuestion3Comments.Text = dv[0][2].ToString();
        lblQuestion5Comments.Text = dv[0][3].ToString();
        lblQuestion4Comments.Text = dv[0][4].ToString();
    }


    As you can see, the data is output from the database in little code. I believe this is far more flexible compared to dragging a dropping a SqlDataSource onto the page. The above code queries the database and then passes the selected fields to a DataView. You can then output each individual column data where you want. In this case, I have output the data to labels:

    //Output Comments to label controls
    lblQuestion1Comments.Text = dv[0][0].ToString(); //Output CommComments column data
    lblQuestion2Comments.Text = dv[0][1].ToString(); //Output RelComments column data
    lblQuestion3Comments.Text = dv[0][2].ToString(); //Output ManageComments column data
    lblQuestion4Comments.Text = dv[0][3].ToString(); //Output RoleComments column data
    lblQuestion5Comments.Text = dv[0][4].ToString(); //Output PersonalComments column data
    
  • Published on
    -
    1 min read

    Simple Way To Use A DataTable

    When I normally create a datatable, I use quite a few lines of code just to add columns and input data into my DataTable.  But recently I have been using the following method use a DataTable in my code. The following function validates RadionButtonLists that I have in my page by passing the RadioButtonList size (rblSize) and RadioButtonList name (rblName).

    //Function: Validate RadioButtonList for each question group
    bool GroupValidateRBL(int rblSize, string rblName)
    {
        bool validateOutput = true;
        int counter = 1;
       
        //Create DataTable object
        DataTable dt = new DataTable();
    
        //Add columns to DataTable
        dt.Columns.Add("No");
        dt.Columns.Add("RadioButtonName");
        dt.Columns.Add("Checked");
    
        while (counter <= rblSize)
        {
            ContentPlaceHolder cph = (ContentPlaceHolder)Page.Master.FindControl("ContentPlaceHolder1");
            RadioButtonList rbl = (RadioButtonList)cph.FindControl(rblName + counter);
    
           //Add Rows to Datatable
           dt.Rows.Add(new string[] { counter.ToString(), rblName, rbl.SelectedIndex.ToString() });
           counter++;
        }
    
        //Iterate through all rows in the DataTable to find all RadioButtonLists that have not been selected
        foreach (DataRow dr in dt.Rows)
        {
            if (Convert.ToInt32(dr["Checked"]) == -1)
            {
                validateOutput = false;
                break;
            }
        }
       return validateOutput;
    } 
    

    The DataTable in the function above stores a list of RadioButtonList entries and then iterates through each row in the DataTable to see if they have been selected. The data is entered into the DataTable by the following line:

    dt.Rows.Add(new string[] { counter.ToString(), rblName, rbl.SelectedIndex.ToString() });
    
  • Published on
    -
    1 min read

    Looping Through RadioButtonLists

    At the moment I am working on a Survey that contains tonnes of RadioButtonList controls that users will use to respond to the numerous questions I have on the website. All was going well until I thought about how I would find a quick and efficient way to enter all the RadioButtonList entries into my SQL database without having to do the following:

    _rblBLL.InsertResults(1, rblist1.SelectedValue);
    _rblBLL.InsertResults(2, rblist2.SelectedValue);
    _rblBLL.InsertResults(3, rblist3.SelectedValue);
    ...
    ...
    ...
    ...
    

    (InserResults() is my BLL function)

    As you can see above, this is indeed a long winded way of inserting all my RadioButtonList entries to the database.

    But I found a better way by using the FindControl() method:

    for (int i=1; i < questionNo; i++)
    {      
        RadioButtonList rbl = (RadioButtonList)this.FindControl("rblist" + i);
    
        if(rbl != null)
        {
             _rblBLL.InsertResults(i, rbl.SelectedValue);
        }
    } 
    

    As you can see, I created a for loop that will iterate through all the RadioButtonLists by incrementing the end value of RadioButtonList ID. So you will have to adopt a naming convention that has a number at the end as shown I have used above.

  • Published on
    -
    1 min read

    ASP.NET Login Authentication Problem

    I was trying to create a Login page for my website in ASP.NET a couple of days ago and I was stumped that the following piece of code did not work:

    private bool SiteLevelCustomAuthenticationMethod(string User, string Password)
    {   
       bool boolReturnValue = false;
       DataTable dtAuthUsers = SomeBLL.GetUsers();
       if (dtAuthUsers != null && dtAuthUsers.Rows.Count > 0)
       {
           DataView dvAuthUsers = dtAuthUsers.DefaultView;
           foreach (DataRowView drvAuthUsers in dvAuthUsers)
           {
                if (User == drvAuthUsers.Row["User"].ToString() && Password == drvAuthUsers.Row["Password"].ToString())
                {
                    boolReturnValue = true;
                }
            }
        }
        return boolReturnValue;
    }
    
    protected void LoginControl_Authenticate(object sender, AuthenticateEventArgs e)
    {
        bool Authenticated = false;
        Authenticated = SiteLevelCustomAuthenticationMethod(LoginControl.UserName, LoginControl.Password);
        e.Authenticated = Authenticated;
        if (Authenticated == true)
        {
            FormsAuthentication.RedirectFromLoginPage(string.Format("{0}", LoginControl.UserName), false);
        }
    } 
    

    Now after numerous debug sessions on this code, I could not find a thing wrong with it. The correct Username and Password was getting parsed to the Database but still the 'SiteLevelCustomAuthenticationMethod' function was still returning a false.

    What was causing this problem was actually quite simple (even though it had taken my a long time to solve!). Basically, in the User's table in my database had the following columns:

    1. User_ID ------> DataType: int
    2. Username ------> DataType: nvarchar
    3. Password ------> DataType: char

    Now this table look alright doesn't it? Well it isn't. The problem lies within the 'Password' column. Since this column format is 'char' with a length of 25, when you enter a password that is less than 25 characters in length a space will be added after to fill out the data length. For example, if you had a password that was 10 characters long, an extra 15 characters of spacing will be added after your password.

    In order to fix this problem, I changed the Password DataType to 'nvarchar', which solved the problem.

  • The SCOPE_IDENTITY() function are used in Insert queries to return the last identity value within your table. However, I never knew how to retrieve the ID value when using this function in my code.

    Create an Insert Query in your Data Access Layer called "InsertUser". For example:

    INSERT INTO Users (FirstName, LastName, DateOfBirth, Email, City) VALUES (@FirstName, @LastName, @DateOfBirth, @Email, @City);
    SELECT SCOPE_IDENTITY() 
    

    When you return to the DataSet Designer you'll see that the "InsertUser" method has been created. If this new method doesn't have a parameter for each column in the table, chances are you forgot to terminate the INSERT statement with a semi-colon. Configure the "InsertUser" method and ensure you have a semi-colon delimiting the INSERT and SELECT statements.

    By default, insert methods issue non-query methods, meaning that they return the number of affected rows. However, we want the "InsertUser" method to return the value returned by the query, not the number of rows affected. To accomplish this, adjust the "InsertUser" method's ExecuteMode property to Scalar (this can be found in the Properties panel on the right).

    The following code will put your new Insert Query into action:

    int intUserID = Convert.ToInt32(BLL.InsertUser("John", "Doe", "16/06/1985", "joe@hotmail.com", "Oxford"));
    //Output new User ID
    Response.Write("New User ID Inserted: " + intUserID); 
    

    For more info regarding the use of Data Access in ASP.NET 2.0 go to: http://msdn2.microsoft.com/en-us/library/Aa581778.aspx