Blog

Blogging on programming and life in general.

  • Android Memory I have a HTC Hero which was recently upgraded from Android 1.5 to 2.1 a few months back. It has definitely been a significant and worthwhile upgrade packing in lots of new extra features and most importantly extra applications to download from the Android Market.

    The only downside to the upgrade is that I now have less memory to play with and this can cause a detrimental effect if you get the “Phone memory is running low” warning. Since I received this warning I found that all my Google Synchronisation tasks stopped syncing automatically. Even if I tried manually starting the synchronisation service nothing would happen. In addition, I couldn’t even download any applications from the Android Market.

    Soon as I went on a massive clear out on my phone and resolved the low memory error, my Google Synchronisation worked instantaneously. All the problems I previously had were magically rectified. Its just a shame that all the applications get stored onto the phone memory rather than the external memory.

    The weirdest thing is that I still had around 14MB of free space on my phone prior to having my cleanup. I find it a little strange the low memory threshold is set so high.

    I guess its good to know that Google has rectified this issue by allowing applications to be stored on external memory in their Android 2.2 release. Unfortunately, it highly unlikely my HTC Hero will see this update.

  • Over the last week or so, I have had the most frustrating time creating a Mac OS X Snow Leopard environment using VMware. I won’t go into the whole process I went through to create my Virtual Machine. There are many online articles for you to Google (or Bing :-P) that show you the step-by-step procedures on how to create a Mac OS virtual environment.

    All I can say it took a lot of blood, sweat and tears! You may find that you need to cross-reference between a few sites in order to get the winning combination for a working VMware environment.

    Anyway, if you are one of the lucky ones to have successfully built a Snow Leopard environment, you may have come across an issue whereby your VMware environment randomly freezes for no apparent reason. Now this is quite annoying. After much searching and constant VMware configuration changes, I could not get to the bottom of the issue. I knew that it could not have been to do with the setup, after all I had a fully functioning Mac environment.

    What I noticed is that my environment would never freeze whilst I was using it. It only froze if I left it idle for long periods of time. You are now probably thinking:

    GET TO THE POINT! HOW DID YOU FIX IT???

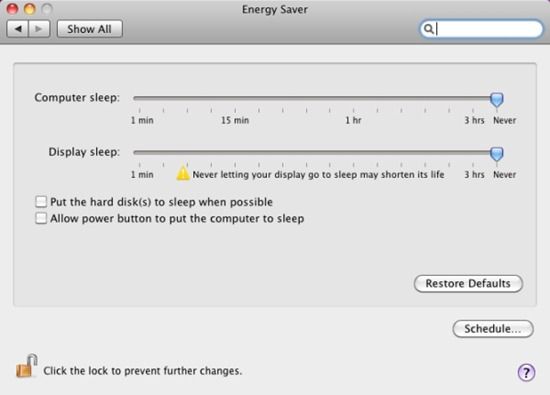
    Well the cause of the environment to freeze is due to the Energy Saver settings found under System Preferences in your Mac OS (Apple icon > System Preferences > Energy Saver). You will find that it is default to 15 minutes idle time before going into sleep mode. All you need to do is set both Computer Sleep and Display Sleep to Never. As a precaution I also unticked the “Put the hard disk(s) to sleep when possible"

    MacOSEnergySaver

  • In SharePoint 2003, you will notice when you change the name of a site, the change is not reflected in the intranet URL. Modifying the site name within “Site Settings” will only change the title that is displayed when you visit the site.

    You have two options to change the site name you see in the URL:

    1. Delete and recreate your site.
    2. Backup your current site and restore content elsewhere on the intranet.

    You really wouldn’t want to consider the first option if your SharePoint site currently stores high volume of information. The best option would be to carry out a backup and restore using SharePoint’s “stsadm” command prompt. The time it takes to run the backup and restore process will entirely depend on the size of your site.

    So here’s the scenario. We have an intranet that currently contains a site called “InsuranceClaims”. However, this site needs to add additional data relating to employee health schemes. The site name in the web address needs to be renamed to “InsuranceAndHealthClaims”. In order to make this change, the following needs to be carried out:

    1. Backup the “InsuranceClaims” site using the stsadm backup command. The site has been backed up to a file called insurancebackup.bak.
    stsadm.exe -o backup -url http://intranet.computing-studio.com/sites/insuranceclaims -filename C:\insurancebackup.bak
    
    1. Create a new site called “InsuranceAndHealthClaims” from the SharePoint intranet.
    2. Restore the contents of the backup to the new site using the stsadm restore command.
    stsadm.exe -o restore -url http://intranet.computing-studio.com/sites/insuranceandhealthclaims -filename C:\insurancebackup.bak
    

    Providing all goes well when you run the backup and restore stsadm commands, you should get a “Operation completed successfully” message.

  • Over the last few months I have had the ability to mess around with a bit of jQuery. Even though I don’t have the complete understanding on how it works, I can see the benefits of writing my code in jQuery compared to bashing out lots of lines of JavaScript to do the same thing.

    One the cool features I have used is calling one of my .NET methods using the “$.ajax” jQuery command. In my example (below), I have created two aspx pages. The code-behind of my first page  (jQueryMethodTest.aspx) will only contain a public static method called “WhatIsYourName”, which returns a string value.

    [WebMethod]
    public static string WhatIsYourName(string name)
    {
        if (!String.IsNullOrEmpty(name))
        {
            return String.Concat("Hello ", name, "!");
        }
        else
        {
            return String.Empty;
        }
    }
    

    Remember, the jQueryMethodTest.aspx page only needs to contain our method nothing else! Additional methods can be added. Just don’t add any web controls.

    The second page (jQueryAjax.aspx), will contain our jQuery code and some HTML to output our result from calling the “WhatIsYourName” method.

    <html xmlns="http://www.w3.org/1999/xhtml">
    <head runat="server">
        <title></title>
        <script type="text/javascript" language="javascript" src="javascript/jquery.js"></script>
    </head>
    <script type="text/javascript">
        $(document).ready(function() {
            $("#btnSubmitName").click(function(event) {
                $.ajax({
                    type: "POST",
                    url: "jQueryMethodTest.aspx/WhatIsYourName",
                    data: "{'name': '" + $('#name').val() + "'}",
                    contentType: "application/json; charset=utf-8",
                    dataType: "json",
                    success: function(message) {
                        ShowPopup(message);
                    },
                    error: NameFailed
                });
            });
        });
    
        function ShowPopup(result) {
            if (result.d != "") {
                $("#Message").html(result.d);
            }
            else {
                $("#Message").html("I didn't get your name.");
            }
        }
    
        function NameFailed(result) {
            $("#Message").html(result.status + ' ' + result.statusText);
        }  
      </script>  
    
    <body>
        <form id="form1" runat="server">
        <div>
            <input id="name" name="name" type="text" />
            <br />
            <input id="btnSubmitName" name="btnSubmitName" type="button" value="Submit" />
            <br /><br />
            <span id="Message" style="color:Red;"></span>
        </div>
        </form>
    </body>
    </html>
    

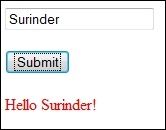
    If all goes well, you should get the following result:

    Calling ASP Method Using jQuery

    The “$.ajax” jQuery command requires the following parameters in order to work:

    • url – links to where our .NET method is placed.
    • data – retrieves the value from some control in our page to pass to our method. Remember, the name of the parameter must be named the same as the parameter from our .NET method.
    • dataType – the response type.
    • contentType – the request content type.
    • success – the JavaScript function that gets fired on postback.
    • error – the Javascript function that gets fired if there is a failure. This is an optional parameter.

    I guess jQuery’s motto really is true: “write less, do more”.

  • UPDATE queries are great to modify all information stored within our column. But what if we needed to only update a specific phrase or word within our column?

    Well, we can use an UPDATE query along with a REPLACE function. It can be used like this:

    UPDATE <table_name>
    SET <column_name> = Replace(<column_name>, 'old phrase', 'new phrase')
    
  • I needed to create a custom web part using Visual Studio 2003 for a SharePoint 2003 client intranet, something I have never done before. As fellow SharePoint developers will know, you need to strongly name your project assembly whenever you need deploy a custom made web part.

    Visual Studio 2005 and onwards allows you to easily create a strongly named key through the graphical user interface. In Visual Studio 2003, you will need to use the Visual Studio 2003 Command Prompt. You can find the Visual Studio 2003 Command Prompt by going to: Start > Program Files > Visual Studio 2003 > Visual Studio.NET Tools > Visual Studio .NET 2003 Command Prompt.

    Visual Studio 2003 Command Prompt

    Once the command prompt window has opened all you need to do is enter the following to create a SNK:

    Setting environment for using Microsoft Visual Studio .NET 2003 tools.
    (If you have another version of Visual Studio or Visual C++ installed and wish
    to use its tools from the command line, run vcvars32.bat for that version.)
     
    C:\Documents and Settings\Administrator\Desktop>sn -k MyKey.snk
     
    Microsoft (R) .NET Framework Strong Name Utility  Version 1.1.4322.573
    Copyright (C) Microsoft Corporation 1998-2002. All rights reserved. 
     
    Key pair written to MyKey.snk
     
    C:\Documents and Settings\Administrator\Desktop>
    

    As you can see from my command prompt example above, I am creating a new SNK file called MyKey.snk. This SNK file will be generated on my Desktop.

  • I had created some .NET UserControl’s that I needed to dynamically add to a Panel control within my page. I previously thought generating my UserControl’s dynamically would be the same as dynamically generating any other .NET Control, like this:

    private void CreateControls()
    {
        //Create control
        TextBox txtUser = new TextBox();
        txtUser.ID = "txtUser";
        txtUser.Text = "Please enter a value";
     
        //Add Control to Panel already in our .NET page
        pnlControlPlaceHolder.Controls.Add(txtUser);
    }
    

    But I was wrong! :-)

    Fortunately, there is a really easy way to to add a UserControl dynamically by simply making use of the “LoadControl” method. The “LoadControl” method takes a single parameter containing the virtual path of your UserControl. For example:

    private void CreateControls()
    {
        //Create control
        Control myUserControl = LoadControl("MyUserControl.ascx") as MyUserControl;
        myUserControl.ID = "ucMyControl";
     
        //Add Control to Panel already in our .NET page
        pnlControlPlaceHolder.Controls.Add(myUserControl);
    }
    

    Easy!

  • As promised, I have been busy creating a custom web part to display Microsoft Charts within my SharePoint reporting dashboard. Before you even think of wanting to use Microsoft Chart in a SharePoint environment, there are a few boring tasks you need to carry out beforehand:

    Step 1: Copy Charting Files To SharePoint

    1. Download Microsoft Chart here.
    2. Ensure the System.Web.DataVisualization.dll is in the GAC of your SharePoint server. If not, go to your Microsoft Chart installation directory (C:\Program Files\Microsoft Chart Controls\Assemblies). You will find all the dll’s here.
    3. Copy the charting images from the MS Chart project directory.
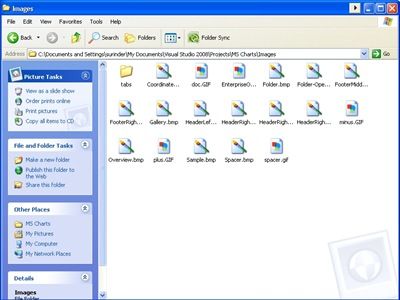
    Image Directory 4. On your SharePoint server, go to the 12 hive and create a new folder called “MicrosoftChartControls” in the Images directory.
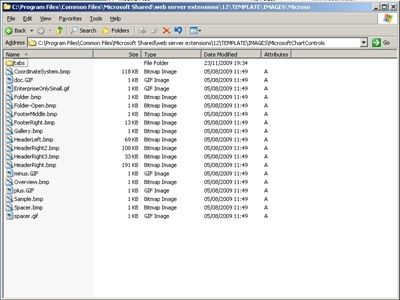
    SharePoint Image Directory

    Step 2: Modify SharePoint’s Web.Config File

    1. Add “System.Web.DataVisualization” to the SafeControls section.
    <SafeControls>
        ...
        ... 
        <SafeControl Assembly="System.Web.DataVisualization, Version=3.5.0.0, Culture=neutral, PublicKeyToken=31bf3856ad364e35"  Namespace="System.Web.UI.DataVisualization.Charting" TypeName="*" Safe="True" AllowRemoteDesigner="True"/>
    </SafeControls>
    
    1. Add the “ChartImg.axd” path to httpHandlers section.
    <httpHandlers>
        ...
        ...
        <add verb="*" path="ChartImg.axd" type="System.Web.UI.DataVisualization.Charting.ChartHttpHandler, System.Web.DataVisualization, Version=3.5.0.0, Culture=neutral, PublicKeyToken=31bf3856ad364e35" validate="false"/>
    </httpHandlers>
    
    1. Add a new AppSetting after the </system.workflow.componentmodel.workflowcompiler> tag. As you can see, this AppSetting contains the URL to where our charting images are stored.
    </System.Workflow.ComponentModel.WorkflowCompiler>
    <appSettings>
        <add key="ChartImageHandler" value="storage=memory;timeout=20;URL=/_layouts/Images/MicrosoftChartControls/" />
    </appSettings>
    
    1. Lastly, ensure you add your own custom web part charting control to the SafeControls section as I have done.
    <SafeControl Assembly="MOSSCharts, Version=1.0.0.0, Culture=neutral, PublicKeyToken=d463a6b3aa294272" Namespace="MOSSCharts" TypeName="*" Safe="True" AllowRemoteDesigner="True" />
    

    If you still have problems with SharePoint failing to recognise the charting API, view this MSDN Forum posting.

    My Custom Chart Example – Bar Chart

    I decided it would be more useful to create a charting web part that would display graphical data from a database, instead of using randomised or hard coded values. My charting web part contains the following properties:

    • Chart Title
    • Database Connection String – in the real world you wouldn’t include this property. But it just makes it so much more easier to change database connection strings.
    • Series 1 Query – will contain a SQL Query based on the results you want returned.
    • Series 1 X Data – the column data you want displayed in the Bar Chart X Axis.
    • Series 1 Y Data - the column data you want displayed in the Bar Chart Y Axis.
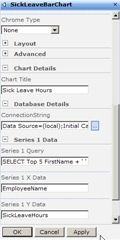
    Chart Properties

    Based on the properties above, your chart will look something like this:

    Custom Chart

    This is how you can create the Bar Chart web part:

    using System;
    using System.Collections.Generic;
    using System.Linq;
    using System.Text;
    using System.Web.UI;
    using System.Web.UI.DataVisualization.Charting;
    using System.Drawing;
    using System.Data;
    using System.Data.Sql;
    using Microsoft.SharePoint;
    using System.Web.UI.WebControls.WebParts;
    using System.Data.SqlClient;
    using System.ComponentModel;
    using Microsoft.SharePoint.WebPartPages;
    using System.Web.UI.WebControls;
     
    namespace MOSSCharts
    {
        public class BarChart : Microsoft.SharePoint.WebPartPages.WebPart
        {
            private string chartName;
            [WebBrowsable(true), Personalizable(true)]
            [Category("Chart Details")]
            [FriendlyName("Chart Title")]
            public string ChartName
            {
                get { return chartName; }
                set { chartName = value; }
            }
     
            private string connectionString;
            [WebBrowsable(true), Personalizable(true)]
            [Category("Database Details")]
            public string ConnectionString
            {
                get { return connectionString; }
                set { connectionString = value; }
            }
     
            private string querySeries1;
            [WebBrowsable(true), Personalizable(true)]
            [Category("Series 1 Data")]
            [FriendlyName("Series 1 Query")]
            public string QuerySeries1
            {
                get { return querySeries1; }
                set { querySeries1 = value; }
            }
     
            private string xColumnDataSeries1;
            [WebBrowsable(true), Personalizable(true)]
            [Category("Series 1 Data")]
            [FriendlyName("Series 1 X Data")]
            public string XColumnDataSeries1
            {
                get { return xColumnDataSeries1; }
                set { xColumnDataSeries1 = value; }
            }
     
            private string yColumnDataSeries1;
            [WebBrowsable(true), Personalizable(true)]
            [Category("Series 1 Data")]
            [FriendlyName("Series 1 Y Data")]
            public string YColumnDataSeries1
            {
                get { return yColumnDataSeries1; }
                set { yColumnDataSeries1 = value; }
            }
     
            protected override void CreateChildControls()
            {
                SPSecurity.RunWithElevatedPrivileges(delegate()
                {
                    try
                    {
                        //**************************************************************
                        //Create Connection String
                        //**************************************************************
                        SqlConnection sqlConn = new SqlConnection(ConnectionString);
     
                        //**************************************************************
                        // Create Chart Control
                        //**************************************************************
                        Chart barChart = new Chart();
                        barChart.Width = 412;
                        barChart.Height = 296;
     
                        //Specify palatte to use
                        barChart.Palette = ChartColorPalette.BrightPastel;
     
                        if (!String.IsNullOrEmpty(ChartName))
                        {
                            Title t = new Title(ChartName, Docking.Top, new System.Drawing.Font("Trebuchet MS", 14, System.Drawing.FontStyle.Bold), System.Drawing.Color.FromArgb(26, 59, 105));
                            barChart.Titles.Add(t);
                        }
     
                        //Create chart area
                        barChart.ChartAreas.Add("ChartArea1");
     
                        // Show as 3D
                        barChart.ChartAreas["ChartArea1"].Area3DStyle.Enable3D = true;
     
                        // Show columns as clustered
                        barChart.ChartAreas["ChartArea1"].Area3DStyle.IsClustered = false;
     
                        // Show X axis end labels
                        barChart.ChartAreas["ChartArea1"].AxisX.LabelStyle.IsEndLabelVisible = true;
     
                        // Set rotation angles
                        barChart.ChartAreas["ChartArea1"].Area3DStyle.Inclination = 15;
                        barChart.ChartAreas["ChartArea1"].Area3DStyle.Rotation = 20;
                         
                        //**************************************************************
                        // Add series data to chart 
                        //**************************************************************
     
                        //Create Series 1 if there is data
                        if (!String.IsNullOrEmpty(XColumnDataSeries1) && !String.IsNullOrEmpty(YColumnDataSeries1) && !String.IsNullOrEmpty(QuerySeries1))
                        {
                            //Add a new series
                            barChart.Series.Add("Series1");
     
                            // Set series chart type
                            barChart.Series["Series1"].ChartType = SeriesChartType.Column;
     
                            // Draw as 3D Cylinder
                            barChart.Series["Series1"]["DrawingStyle"] = "Cylinder";
     
                            barChart.Series["Series1"].BorderColor = Color.FromArgb(26, 59, 105);
                            barChart.Series["Series1"].Color = Color.CornflowerBlue;
                            barChart.Series["Series1"].BackSecondaryColor = Color.Navy;
                            barChart.Series["Series1"].BackGradientStyle = GradientStyle.DiagonalLeft;
    
                            barChart.Series["Series1"]["PointWidth"] = "0.8";
     
                            SqlCommand sqlCmdSeries1 = new SqlCommand(QuerySeries1, sqlConn);
     
                            barChart.DataSource = sqlCmdSeries1;
     
                            barChart.Series["Series1"].XValueMember = XColumnDataSeries1;
                            barChart.Series["Series1"].YValueMembers = YColumnDataSeries1;
    
                        }
     
                        barChart.DataBind();
     
                        Controls.Add(barChart);
                    }
                    catch (Exception ex)
                    {
                        Label lblError = new Label();
                        lblError.Text = "An error has occurred. Please ensure you have entered correct chart details";
     
                        Controls.Add(lblError);
                    }
                });
            }
        }
    }
    

    The code (above) provides a basis to display a database driven chart within SharePoint. With some further tweaks, your Reporting Dashboard could look something like this:
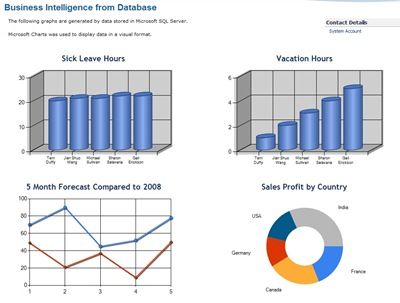
    SharePoint Report Dashboard

    If you would like the code for some of my other charts displayed within my Reporting Dashboard, please leave a comment.

  • I am sure all developers in the past have attempted to create their own bar or pie chart using .NET’s System.Drawing methods. However, I never been able to match a high quality finish similar to what you would expect from third party charting software. You can see my charting attempt in my post: Outputting Custom Made Charts.

    As much as I would like to use .NET charting solutions from the likes of DotNetCharting and FusionCharts, they are just too expensive to buy. I have downloaded trial versions and been thoroughly impressed with their range of charts and functionality.

    But it seems I have been quite late in noticing Microsoft have released their own range of chart controls to easily create rich professional looking visual data. Having had a play around in Microsoft Charts earlier this week, I have to say I am a big fan. Its a shame I hadn’t found it earlier.

    From looking around that net, there are many articles and blogs on how to use Microsoft Chart so I am not going to write another. Ha! But in the next day or two, I plan to blog on how I implemented Microsoft Chart as a web part within my Report Center in SharePoint 2007. So watch this space.

    In the meantime here are some useful links I have used to get started in Microsoft Chart:

  • A little while back I renamed all URL’s within my SharePoint 2007 virtual environment. You can view my posting here. When it came to viewing users My Site, the new URL did not update after making changes to the Alternate Access Mappings within Central Administration.

    So if you have the same problem or if you just need to change your My Site URL, here is a tutorial on how to fix this problem:

    1. Go to “Alternate Access Mappings” in SharePoint Central Administration > Operations. Click on the URL that corresponds to your My Site. This will take to you to the “Edit Internal URLs” page, allowing you to modify the My Site URL.

    Alternate AccessMappings

    Edit Internal Urls

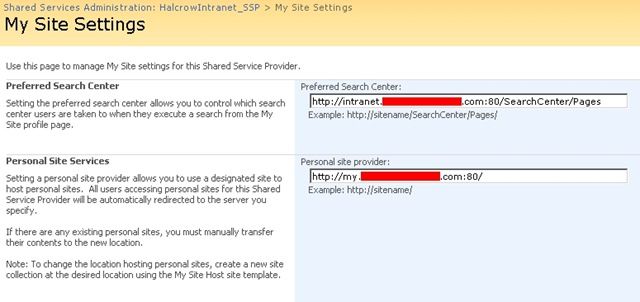
    1. Go to “My Site Settings” which can be found in the Shared Service you configured in Shared Services Administration. Again, enter your new My Site URL.

    My Site Settings

    1. Modify your IIS site host header value to match the URL your entered in Central Administration.

    2. Carry out an iisreset.